


Remote probes are an important part of Paessler PRTG. They allow you to monitor networks and devices in remote locations or branch offices. A remote probe acts as an additional monitoring instance and provides the sensors to monitor networks, devices and applications. Remote probes monitor autonomously and send the monitoring results back to the PRTG core server for each check they perform.
During installation, PRTG automatically creates the first probe - for Paessler PRTG Network Monitor and Paesler PRTG Enterprise Monitor it's the local probe, and in Paessler PRTG Hosted Monitor it's the hosted probe. They run on the PRTG core server system and monitor all accessible devices, servers and services of the system with the sensors you have configured.
Remote probes with PRTG Hosted Monitor
For pure network monitoring with PRTG, or if you only want to monitor one location, a local probe should be sufficient. For monitoring with PRTG Hosted Monitor, at least one remote probe is required, since the hosted probe can only reach targets that are publicly accessible via the Internet.

When remote probes are required
- You want to monitor your local network using PRTG Hosted Monitor (see above).
- You have more than one business location and need to ensure that services are available from all locations.
- Your network is divided into multiple LANs separated by firewalls, and the local probe cannot monitor certain services across these firewalls.
- You want to monitor systems that are located in a secure network, and you need a secure connection between the PRTG core server and this network.
- You are experiencing performance issues with CPU-intensive sensors such as Packet Sniffer or NetFlow sensors and need to distribute the load across multiple hosts.
Here's an example of a Remote Probe scenario:
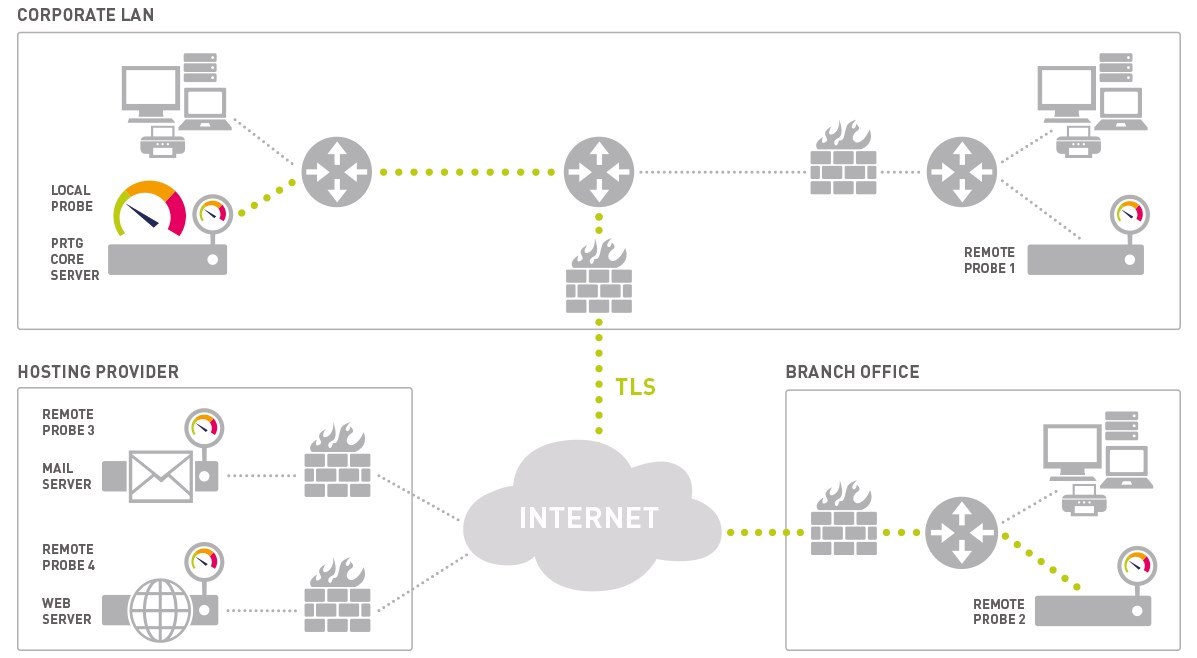
The PRTG core server inside the corporate LAN can monitor:
- Services that are located on the corporate LAN and are using the local probe (top left).
- Services that are located behind a firewall on the corporate LAN (Remote Probe 1).
- Secured services that are located inside the branch office (Remote Probe 2, bottom right).
- Secured services on a mail server and web server (Remote Probe 3 and Remote Probe 4, bottom left, are installed directly on these servers).
- Public services on the internet using any of the probes.
How PRTG Probes work
As soon as a probe is started, it automatically connects to the PRTG core server, downloads the sensor configuration, and starts its monitoring tasks. The PRTG core server sends new configuration data to a probe as soon as the user changes the monitoring configuration. Probes monitor autonomously and send the monitoring results back to the PRTG core server for each check they perform.
The connection between a probe and the PRTG core server is initiated by the probe and secured using Secure Sockets Layer (SSL)/Transport Layer Security (TLS). The PRTG core server provides an open TCP/IP port and waits for connection attempts from probes. When a new probe connects for the first time, you will receive a ticket and then see the new probe in the device tree.
When running PRTG in a cluster, remote probes also connect to all cluster nodes and send monitoring data. This works the same as it does for a single PRTG core server (explained above). If the master node fails, you can still see monitoring data on the failover nodes.
For more information, including how to automatically update or delete remote probes, click here:
👉 PRTG Manual: Remote Probes and Multiple Probes
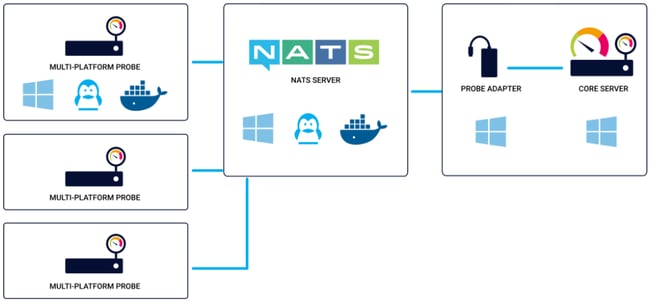
What about the Multi-Platform Probe?
About a year ago we introduced the Multi-Platform Probe, which can be installed on Windows and Linux systems (Ubuntu, Debian and CentOS) as well as on ARM-based devices and Docker. This extends PRTG's native monitoring capabilities to other platforms. Since its release, our software developers have continued to improve it and there are now more than 40 sensors available.
Currently, the Multi-Platform Probe is still in the alpha phase, and its functionality is not yet comparable to that of a remote probe. However, we encourage you to try it out. With the release of PRTG version 23.1.82, a "sensor package" is now available that allows you to monitor the availability of your systems. In addition, you can now use the Script v2 sensor to create your own scripts and monitor additional aspects.
For more information on how to install the Multi-Platform Probe, see this article. An overview of the sensors supported by the Multi-Platform Probe can be found here.
 We’d love to hear your feedback and therefore we want to involve you in the development process from the very beginning to understand your needs and to be able to respond to your requests. To this end, we would like to invite you to a one-on-one meeting to discuss the status of the Multi-Platform Probe.
Sound interesting?
👉 Then get in touch with our colleague Antje Pich!
Join one of our webinars!
We would also like to invite you to our upcoming PRTG Development Insights Webinar. Sign up today already for the webinar on April 27, 2023, to be involved in the next milestone for our PRTG Multi-Platform Probe. Get your front row seat to development and get insights before anyone else! No marketing, no sales - just pure technical insights and room for your feedback!
Simply use the link below to register for the webinar: